
Memory and CPU of eight coding-agent apps on one Mac
On November 9 and 10 I measured Yardlet 0.11.10 and seven other coding-agent apps on one MacBook Pro: idle on first launch, with ten tasks streaming, with twenty browser tabs and over an hour. Here are the numbers, where Yardlet does worse, what the table leaves out, and the raw data.
I make Yardlet, a free, open-source Mac app that runs coding agents like Codex and Claude Code in one window.
I started it because the agent apps I was using kept eating my Mac. With a few agents going at once, the Electron apps took more and more of its memory, so I wrote a native one. That was a feeling, not a measurement. On November 9 and 10 I measured Yardlet against the apps people actually use for this, on one Mac, all in the same way. This post is the record of those two days. Every one of these apps ships often, so read it as a dated snapshot, not a ranking.
What I measured
Eight apps, each the latest public release on November 9 (for T3 Code, the latest one that isn't a nightly), each download checked against its published SHA-256 and Apple's notarization: Yardlet 0.11.10, Herdr 0.1.14 (with its herdr-core server 0.1.19), Conductor 0.93.0, cmux 0.65.2, Superset 2.0.6, T3 Code 0.1.7, Paseo 0.15.3 and Orca 1.4.254. Yardlet 0.11.11 came out after these runs and isn't in the table. The Codex app and the Claude app aren't either: both start at a sign-in screen, and this run used no accounts.
Everything ran on one MacBook Pro (M1 Pro, 16 GB) on macOS 15.6.1, with Docker Desktop running as it usually does on that Mac. Every app started in a fresh, empty home folder, with no saved settings and no sign-in. The claude and codex commands were stand-ins: small scripts that answer the way the real CLIs do but call no model, so nothing left the machine and every app got the same kind of streamed output at the same pace, about 30 fragments a second.
Memory is the sum of phys_footprint, the number Activity Monitor shows as Memory, for every process macOS charges to the app: its own processes, web renderers, GPU helpers, the system WebKit services its web views use, and the shells and servers it starts. Herdr runs its agents through a separate server, herdr-core, which macOS doesn't charge to the app, so I added it to Herdr. The stand-in agent CLIs are left out of every total. CPU is the average over the sample, sampled once a second; 100% is one full core.
Idle, on first launch
Each app was opened for the first time, left alone for 60 seconds, then sampled for 120 seconds. Three runs, in rotating order; the median run is shown.
| App | Memory | CPU | First screen |
|---|---|---|---|
| Yardlet 0.11.10 | 53 MiB | 0.5% | Home screen |
| Herdr 0.1.14 | 77 MiB | 0.9% | Main window, no sign-in |
| Conductor 0.93.0 | 153 MiB | 6.0% | Empty window before sign-up |
| cmux 0.65.2 | 193 MiB | 28.9% | Welcome video |
| Superset 2.0.6 | 259 MiB | 0.2% | Sign-in |
| T3 Code 0.1.7 | 532 MiB | 1.2% | Onboarding |
| Paseo 0.15.3 | 537 MiB | 6.1% | Setup |
| Orca 1.4.254 | 675 MiB | 17.2% | Onboarding |
This is the cost of each app's first screen, which is what a new user sees, not of a signed-in app with real projects. Conductor and Superset need an account to go further. cmux plays a welcome video on first launch; on a second launch, without it, cmux used 168 MiB and 2.9%.
Under load
The load scenes need a chat view that accepts the stand-in agent without an account, so only three apps ran them: Yardlet, T3 Code and Paseo. The clicks and typing were scripted, the same for every app, in the same window size. One run per scene.
- Ten tasks streaming: ten tasks, each starting with a long history, stream at once for about six and a half minutes; five minutes sampled.
- Switching long tasks: with that history, the next task opens every 10 seconds and scrolls up and back, for five minutes.
- Twenty browser tabs: twenty real public pages (GitHub repositories, pull requests and issues; documentation for Apple, Python, MDN, React, Tailwind, Next.js, Kubernetes and TypeScript; two Wikipedia articles, Stack Overflow, Hacker News, Reddit, and the Vercel, Figma and MacBook Pro pages) in the app's built-in browser; a minute to settle, then two minutes sampled.
- One-hour session: in that state, with the twenty tabs still open, three tasks get a new two-minute streaming turn every 5 minutes, the browser moves to its next tab every 30 seconds, and in between the next task opens and scrolls every 10 seconds.
| Scene | Yardlet 0.11.10 | T3 Code 0.1.7 | Paseo 0.15.3 |
|---|---|---|---|
| Ten tasks streaming | 214 MiB · 45% | 867 MiB · 47% | 987 MiB · 67% |
| Switching long tasks | 275 MiB · 7% | 774 MiB · 8% | 845 MiB · 10% |
| Twenty browser tabs | 2,474 MiB · 1.6% | no browser | 4,227 MiB · 90% |
| One hour, memory start → end | 1,793 → 1,847 MiB | 798 → 908 MiB | 4,361 → 4,362 MiB |
| One hour, CPU | 16% | 16% | 100% |
Memory in the first three rows is the median over the sample. The one-hour rows give the first and the last minute's memory and the average CPU. Yardlet ran for two hours; its first hour is shown, and it ended the second hour at 1,904 MiB. Yardlet counted one process in the first two scenes and 27 in the browser scene; Paseo counted 56 there.
T3 Code has no built-in browser, so its one-hour session has no tabs in it, while Yardlet's and Paseo's carry twenty. Its lower memory there isn't a like-for-like comparison with Yardlet; the browser comparison is Yardlet against Paseo. T3 Code also ran the Claude Code stand-in, because its Codex path needs a ChatGPT sign-in; Yardlet and Paseo ran the Codex one.
Where Yardlet does worse
- At idle, Superset's sign-in screen used less CPU than Yardlet: 0.16% against 0.48%.
- Yardlet is the only one of these apps that starts an agent CLI at launch, a Codex app-server that reads the account. Here it was the stand-in and left out of the total. The real one adds memory of its own.
- Twenty tabs cost Yardlet 2.5 GB, most of it in its browser's web renderers. That is less than Paseo's 4.2 GB for the same pages, but it is the largest number Yardlet has in this post. I didn't run Yardlet's one-hour session without tabs, so the table can't tell you what it uses over an hour if you never open the browser.
- In the two-hour session Yardlet's main thread was busy for a quarter of a second or more 264 times, 122 of them in the first hour. The median was 0.28 seconds and the longest 0.44 seconds. Yardlet logs these pauses itself; the other apps don't, so I couldn't compare them.
What this doesn't tell you
The agent CLIs were stand-ins. Real models, real agent output and signed-in apps weren't measured, and a real agent CLI costs memory of its own in every app. Startup time and how responsive each app feels weren't measured either.
It's one Mac. Docker Desktop's VM took about 4.8 GB on it, so free memory was low, especially in the load scenes, and CPU may read higher than on a roomier Mac. Each load scene ran once.
Herdr, cmux and Orca were measured idle only this time. They show agents in a terminal, which would be a separate comparison from a chat view, and I ran out of time for it. Conductor and Superset need an account before they show anything else.
Checking it yourself
Everything behind the tables is next to this post:
- runs.csv: every run, with the median and largest memory, the average and 95th-percentile CPU, the process count and the load average. It includes the second launches, Yardlet measured again beside Herdr later that evening, and two runs I excluded. Those two stopped at a macOS "Keychain Not Found" dialog that an empty home folder brings up and that a user with a login keychain never sees, so I measured those apps again.
- fake-codex.py and fake-claude.py: the stand-ins as I used them. They grew from the ones in the Yardlet repository's scripts/perf-bench, with a few more answers that the apps ask for.
- sample-group.swift: the sampler. Once a second it reads
phys_footprintand CPU time withproc_pid_rusagefor every process under the app's bundle or charged to it by macOS. - The table as one image.
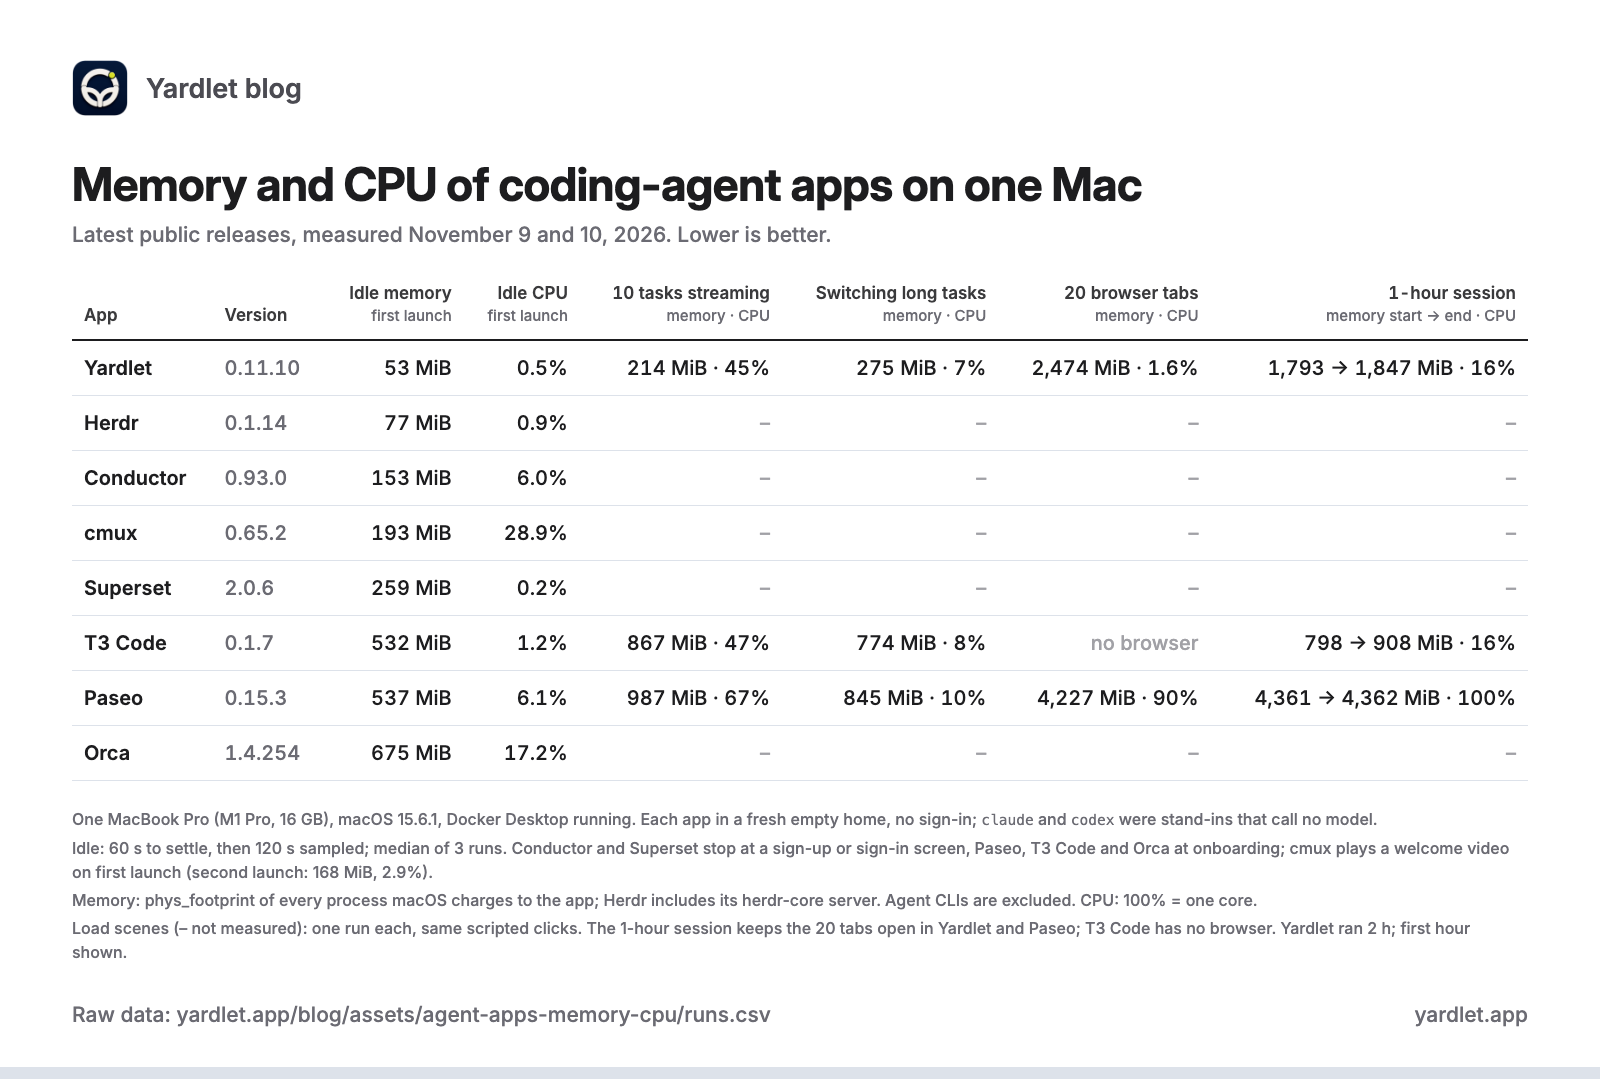
To repeat the idle runs on your own Mac, download each release and check its SHA-256 and notarization, start it with HOME and CFFIXED_USER_HOME pointing at an empty folder and the stand-ins first on PATH, cancel the keychain dialog if one appears, wait 60 seconds, and run the sampler for 120.
If I run this again, it will be a new, dated post rather than an edit to this one.